
Do you know if this month’s sales are on target, and who still owes you money? This free sales tracker answers both. Log each sale once, and the template compares every month with your target, ranks your salespeople and highlights unpaid invoices.
Download the free sales tracker template (.xlsx)
What is inside
| Sheet | What it does |
|---|---|
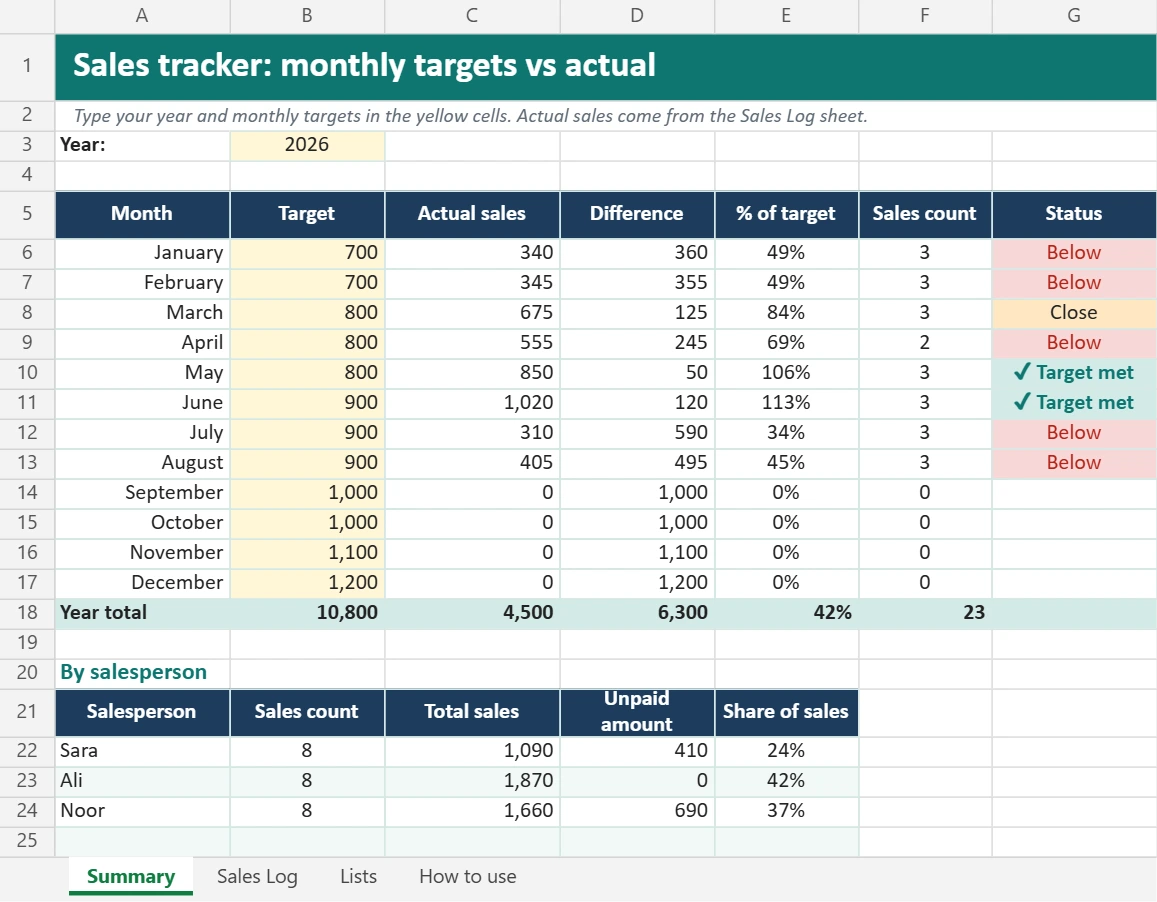
| Summary | Monthly target vs actual, difference, % of target, number of sales and a status for each month, plus a year total |
| By salesperson (on Summary) | Each person’s sales count, total, share of sales and unpaid amount |
| Sales Log | One row per sale: date, invoice number, customer, product, salesperson, quantity, unit price, automatic total and payment status (300 rows) |
| Lists | Edit salesperson names and payment statuses |
Smart features
- Automatic monthly totals from your sales log, so there’s nothing to copy across.
- Clear status: ✔ Target met (100%+), Close (80–99%) or Below, with colors.
- Unpaid alerts: unpaid sales turn red, partly paid turn orange.
- Change the year in one cell to start a new year.
- 3-decimal currency format (for BHD, KWD, OMR). Easy to switch to 2 decimals.
How to use it
- Set the year and targets: on the Summary sheet, type the year and a target for each month in the yellow cells.
- Add your team: type salesperson names on the Lists sheet.
- Clear the samples: delete the example rows in the Sales Log.
- Log every sale: date, customer, product, salesperson, quantity and price. The total calculates itself.
- Update payment status when customers pay.
- Review weekly: check the month’s % of target and filter the log for unpaid sales.
Add a chart in 30 seconds
- On the Summary sheet, select cells A5:C17 (Month, Target, Actual).
- Go to Insert → Column chart (or Combo chart: Target as a line, Actual as columns).
- Move the chart next to the table. It updates automatically as you log sales.
More chart ideas in our Excel dashboard tutorial.
Setting realistic targets
- Start from last year’s sales for the same month, and add a realistic growth rate (for example, 5–10%).
- Plan for seasons: Ramadan, summer, holidays and year-end are often very different.
- Break the yearly goal into months, then weeks, so the team knows what “on track” looks like.
Use it in Google Sheets
Download the file and choose File → Import → Upload in Google Sheets. Share it with your sales team so everyone logs sales in one place.
FAQ
Can I track products instead of salespeople?
Yes. Filter the log by the Product column, or build a pivot table from the Sales Log to total sales by product.
How do I connect this to my invoices?
Use the invoice number column to match each sale with an invoice from our free invoice template.
Can I track leads before they become sales?
Yes. Use our simple CRM template for leads and deals, and this tracker for closed sales.